Below is a sample and a short explanation for all Financial Reports
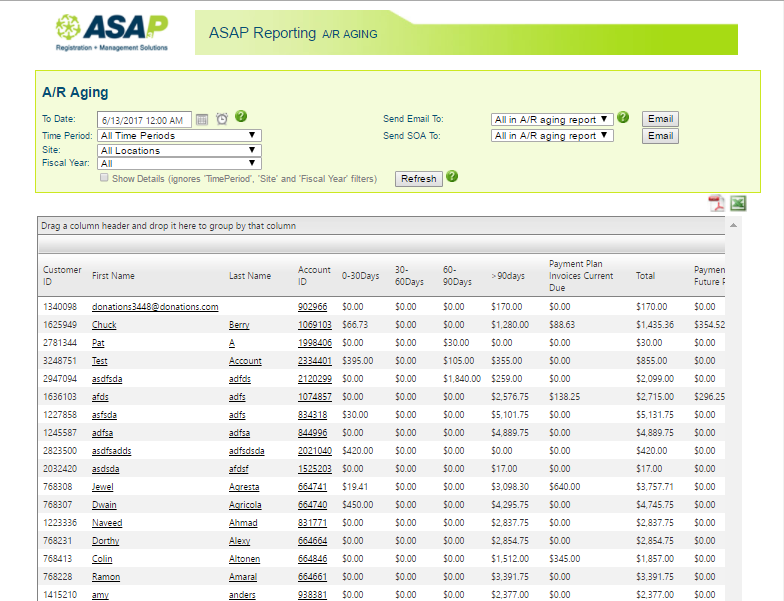
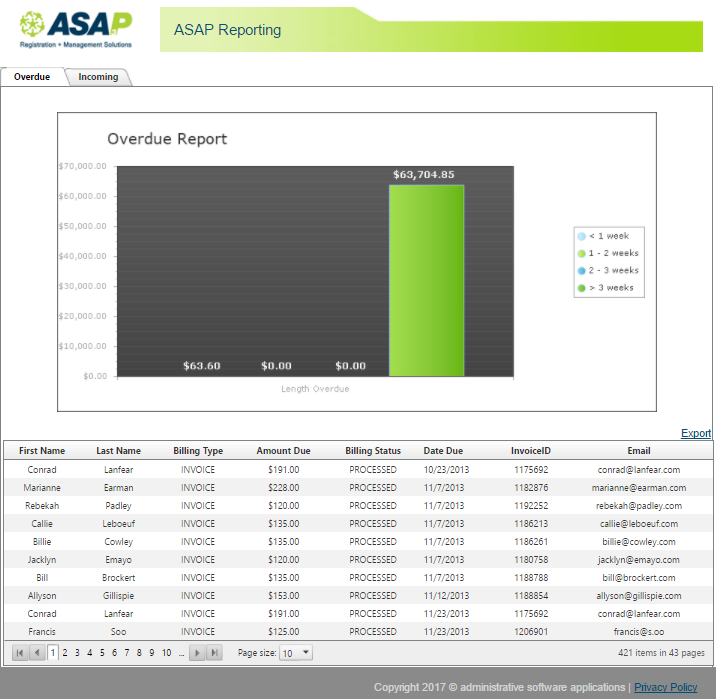
A/R Aging Report
Several different things can be done with the A/R Aging Report. All invoices due (up to a specified date) can be shown by choosing a to date and clicking refresh. Additionally, an email can be sent directly to a group of students with payment due by selecting the aging criteria and clicking Email. This second option takes you directly to the Manage Email area of ASAP.
If the report is simply being run (and students aren't being emailed directly from this report) you will see a spreadsheet-like format that shows you a line-item representation of each payment due. The report will show customer ID, last name, first name, company ID (if applicable), a listing of how much is due and which range each belongs in and totals.
All of the variables in the report can be grouped. Simply drag the header of the column you wish to group by to the header area that says Drag a column header here to group by that column and you will see the data grouped by that variable.
The variables in the columns can be collected with the symbol at the top of each column. Select the symbol that you want to use and type the variable that you want to see based on that symbol.
This report can be exported as an Excel spreadsheet and as a PDF.
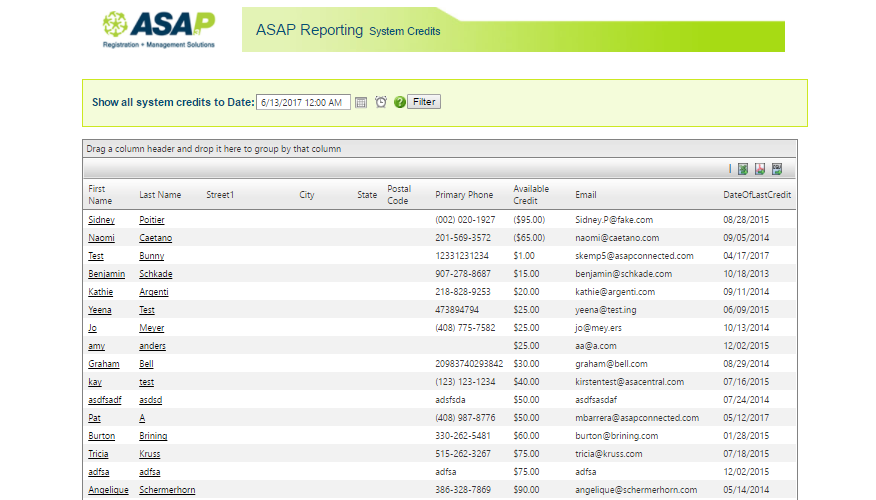
Accounts Credits Report
The Account Credits Report shows any account with existing internal account credit up to a specified date. This report shows the following data (if you have edited the terminology for these fields, the same data fields will display with your customized terminology): first name, last name, street address, city, state, postal code, primary phone, available credit and email address.
There is a link for each line item that takes you directly to the account on that line.
All of the variables in the report can be grouped. Simply drag the header of the column you wish to group by to the header area that says Drag a column header here to group by that column and you will see the data grouped by that variable.
The variables in the columns can be collected with the symbol at the top of each column. Select the symbol that you want to use and type the variable that you want to see based on that symbol.
This report can be exported as an Excel spreadsheet and as a PDF.
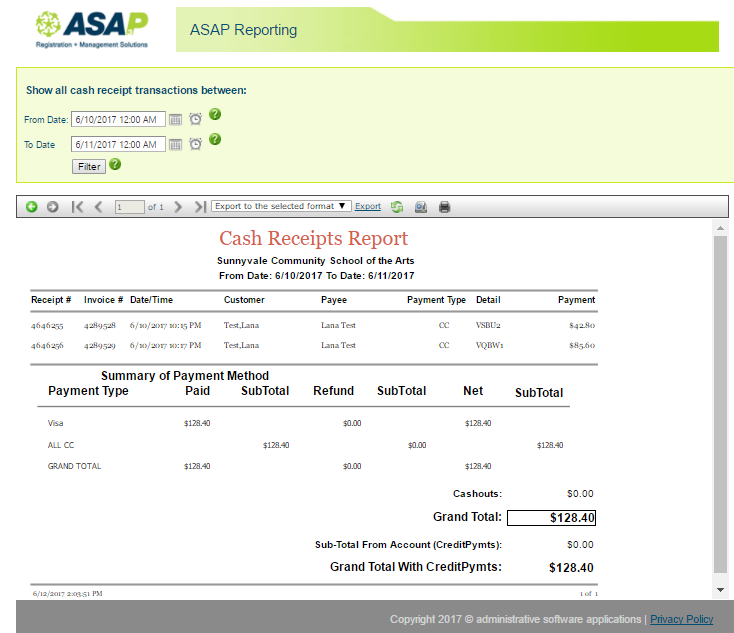
Cash Receipts Report
Although this is called the Cash Receipts report, this report also shows checks, credit cards and credit (internal) payments. After the date range is specified and the data is filtered, the following variables will be visible: receipt number, invoice number, date and time of transaction, customer, payee, payment type, any details and the payment amount. The final page of the report shows summary information.
This report can be exported to a variety of formats and can be printed.
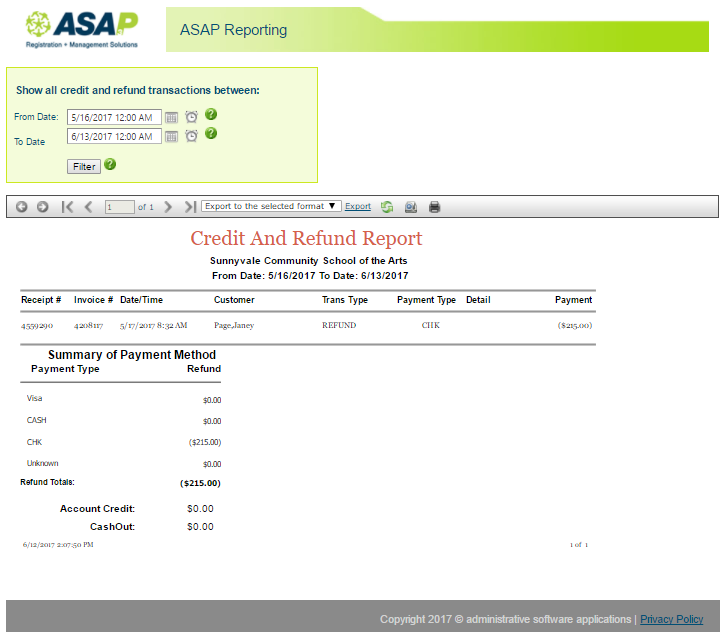
Credits and Refunds Report
The Credits and Refunds Report shows credits and refunds over a specified date range.
It shows the following variables: receipt number, invoice number, date and time of refund/credit transaction, customer name, transaction type (credit or refund), payment type (if a refund was made, this is how the refund was given), any details recorded in the transaction and the amount of the refund/credit.
This report can be exported to a variety of formats and printed.
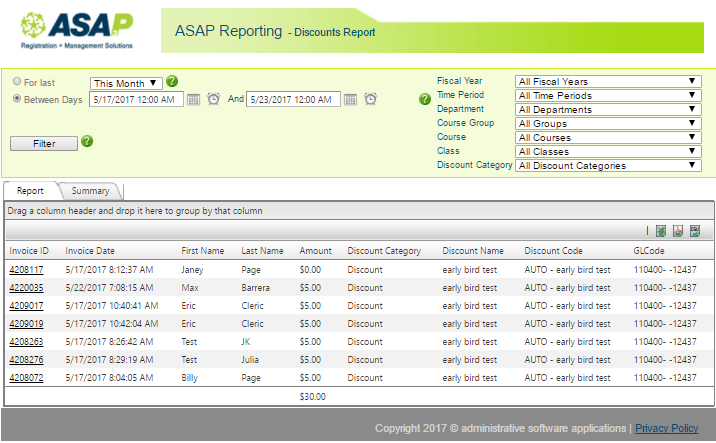
Discounts Report
The Discounts Report shows spreadsheet-like format that shows you a line-item representation of each discount that was given within a specified segment of time (last day, week, month or year) or over a specified date range. It also calculates the total discounts for the specified segment or date range.
There are View Invoice links to the left of each line item that allow you to open the invoice detail screen for the student for the line item.
All of the variables in the report can be grouped. Simply drag the header of the column you wish to group by to the header area that says Drag a column header here to group by that column and you will see the data grouped by that variable.
The variables in the columns can be collected with the symbol at the top of each column. Select the symbol that you want to use and type the variable that you want to see based on that symbol.
This report can be exported as an Excel spreadsheet.
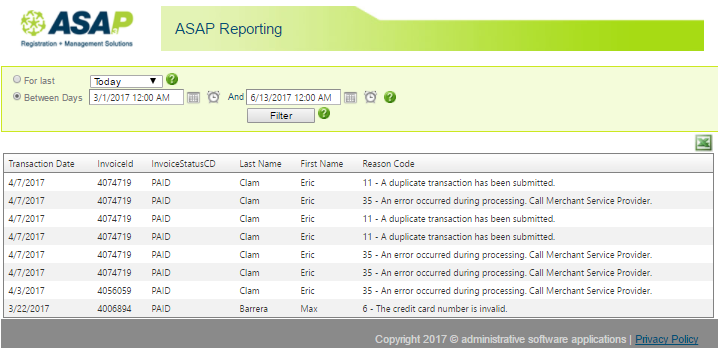
Failed Transactions Report
The Failed Transactions Report shows spreadsheet-like format that shows you a line-item representation of each failed transaction within a specified segment of time (last day, week, month or year) or over a specified date range. It also calculates the total discounts for the specified segment or date range.
This report shows the transaction date, invoice id, first name, last name and reason code.
The variables in the columns can be collected with the symbol at the top of each column. Select the symbol that you want to use and type the variable that you want to see based on that symbol.
This report can be exported as an Excel spreadsheet and as a PDF.
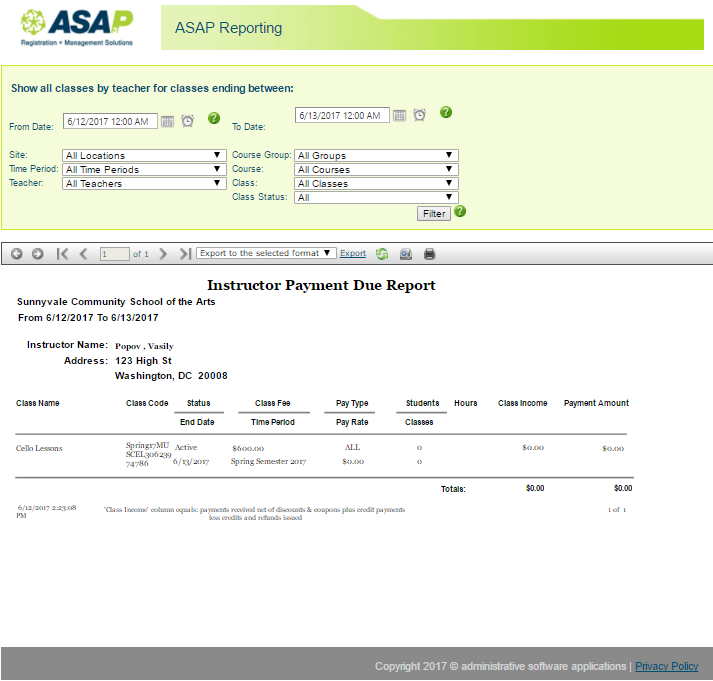
Instructor Payment Due Report
The Instructor Payment Due Report shows classes that are ending soon. It is run by date range and can be run for all or one location, time period, teacher, course group course and class.
It shows one instructor record per sheet and includes the following variables: class name, class code, end date, class fee (regular/default fee only), time period, pay rate (if included in class details), number of students in the class(es), number of classes, class income and payment amount (if pay rate was included in class details).
This report can be exported to a variety of formats and printed.
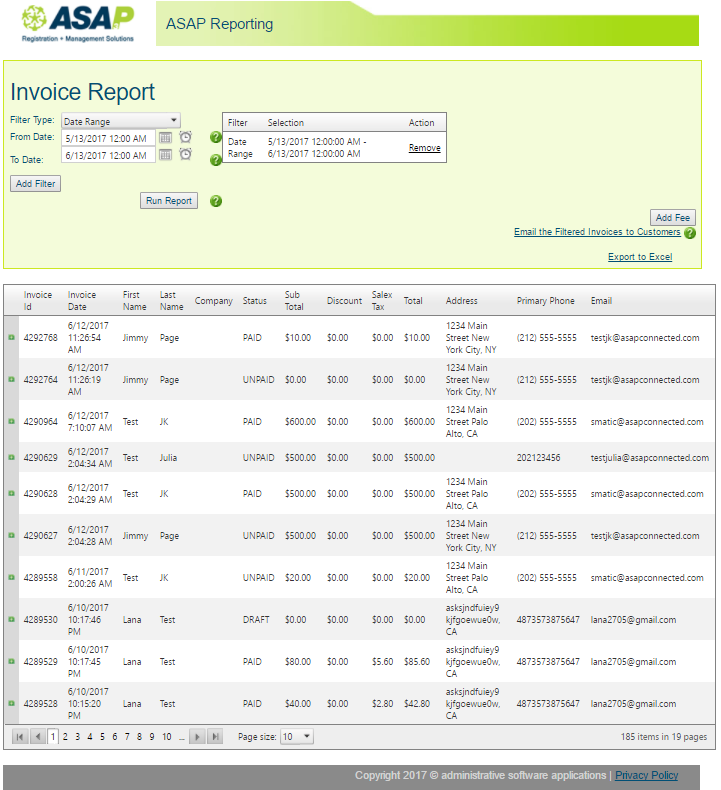
Invoice Report
The Invoice Report can be run with the following filters with the ability to select multiple ones:
- Date Range
- Instructor
- Invoice ID
- Invoice Status
- Invoice Type
- Location
- Time Period
- Past Due
The report shows each invoice as a line item. Each line item, and many sub-items, can be expanded (by clicking the green plus sign at the far left of each row) to open more detail about the invoice.
Unopened invoices show the following details: Invoice ID, Invoice Date, First Name, Last Name, Company (if applicable), Invoice Status, Invoice Sub Total, Discounts and Total.
Opened / expanded invoices will show this additional information: item name, item cost, quantities, discounts, total cost, refund amount, payment applied, transaction date, payment amount, payment type, gateway transaction id, processed by, check number and transaction notes.
This report can be exported to Excel and there is a link to email the invoices to customers directly, as well as add a fee to whichever invoices are selected.
Payment Plan Report
The Payment Plan Report shows any recurring billing and invoicing statements that are recent or upcoming. This will only show invoices that are currently on a payment plan and have the status 'PYMTPLAN'. What this will allow you to do is to keep track of your pending and on-going invoices that either will have an incoming charge or are overdue for payment. This is handy to keep track whenever you're expecting any payments to charge and to check on the status of that customer's payment.
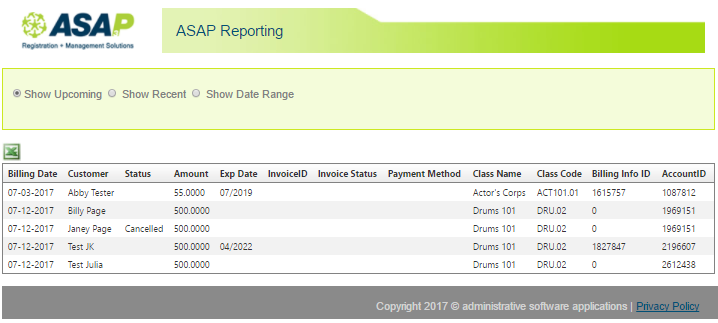
Recurring Billing Report
The Recurring Billing Report shows any recurring billing and invoicing statements that are recent or upcoming.
This report can be run to show upcoming, recent, or statements over a specific date range.
This report will show the billing date, customer name, status, amount, expiration date of the credit card (if applicable), invoice id (if the invoice has already been generated), status of the invoice, if they're billing to the invoice or saved credit card, the class name, the class code, the specific billing info ID, and the account ID.
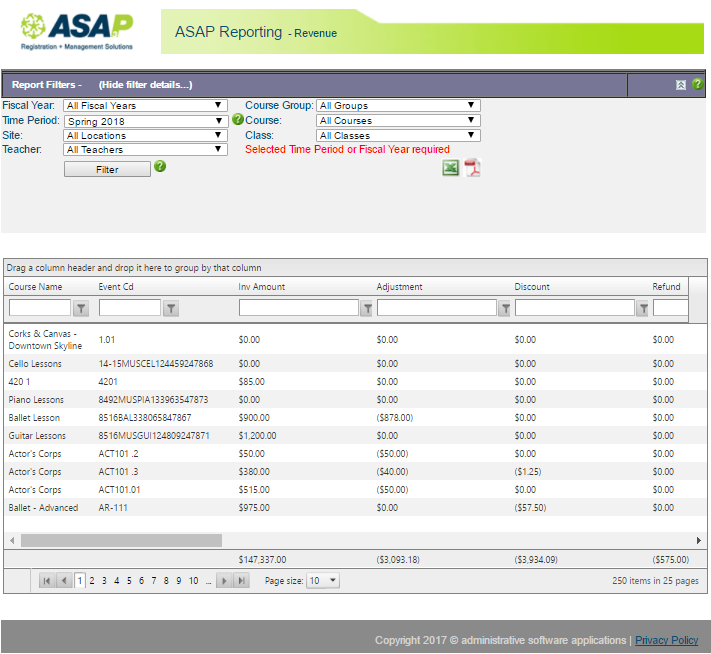
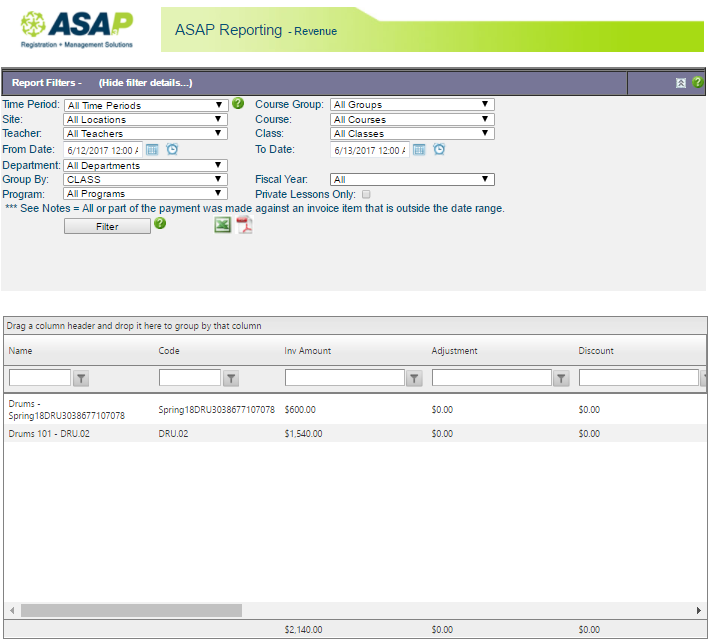
Revenue (grid) Report
The Revenue (grid) Report shows spreadsheet-like format that shows you a line-item representation of each revenue item. This report displays total class revenue by time period or Fiscal Year. The report is run one time period/Fiscal Year at a time and can be run for one or all sites, teachers, course groups, courses and classes.
All of the variables in the report can be grouped. Simply drag the header of the column you wish to group by to the header area that says Drag a column header here to group by that columnand you will see the data grouped by that variable.
The variables in the columns can be collected with the symbol at the top of each column. Select the symbol that you want to use and type the variable that you want to see based on that symbol.
This report can be exported as a PDF or to Excel.
Revenue Report with Grouping Report
The Revenue Report with grouping displays a spreadsheet-like format that shows you a line-item representation of each revenue item. This report displays total class revenue by date range. The report is run through a specific date range and can be run for one or all sites, teachers, course groups, courses and classes.
All of the variables in the report can be grouped. Simply drag the header of the column you wish to group by to the header area that says Drag a column header here to group by that column and you will see the data grouped by that variable.
The variables in the columns can be collected with the symbol at the top of each column. Select the symbol that you want to use and type the variable that you want to see based on that symbol.
This report can be exported as a PDF or to Excel.
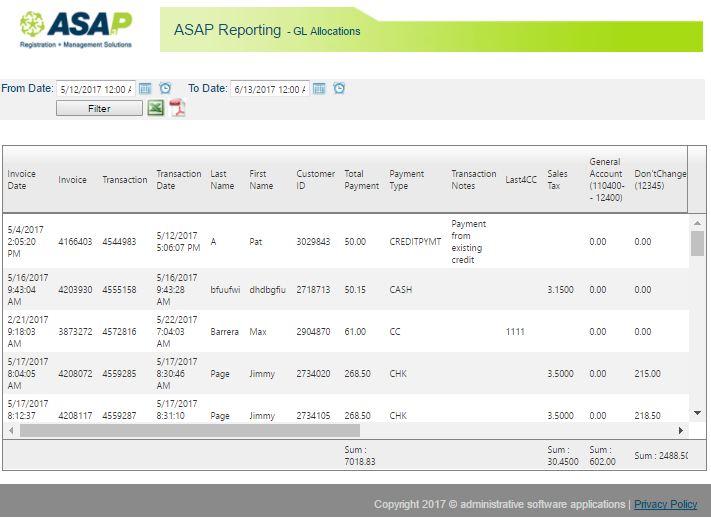
Transaction G/L Breakdown Report
The Transaction G/L Breakdown report shows how a transaction recorded in ASAP is broken down by each G/L code. The columns we show are the Invoice Date. Invoice ID, Transaction ID, Transaction Date, Last Name/First Name, Customer ID, Total Payment, Payment Type, Transaction Notes, Last 4 CC, and G/L codes configured in your organization. We display all G/L codes, regardless if it's archived or not, due to older transactions possibly having belong to a code that is no longer available in your system. You can only filter through a date range and export it to either excel or PDF.
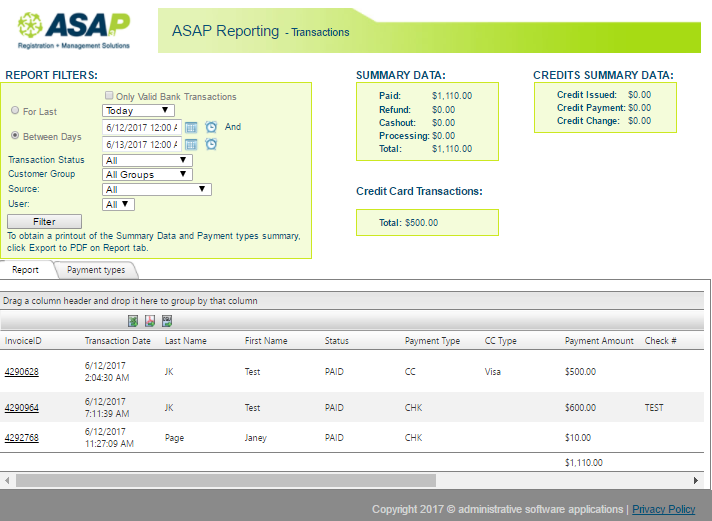
Transaction Report
The Transaction Report shows spreadsheet-like format that shows you a line-item representation of each transaction. This report displays transactions over a date range or over a specified chunk of time: today, yesterday, this week, this month, this year.
This report can be run for one or all transaction types, customer groups, sources (on-line and in-house) and user. It can be run to show only valid bank transactions (credit cards that were processed online only) or for all transaction types.
This report shows summary data for the selected variables at the top right of the report.
The bulk of the report shows the following data: invoice id, transaction date, last name, first name, status, type, check number, gateway transaction id, payment amount and processed by.
The variables in the columns can be collected with the symbol at the top of each column. Select the symbol that you want to use and type the variable that you want to see based on that symbol.
This report can be exported as a PDF or to Excel.
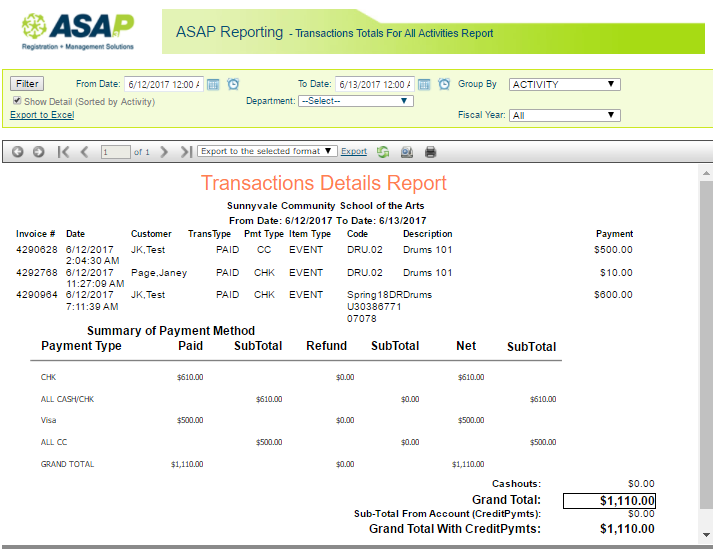
Transaction Totals for All Activities Report
The Transaction Totals for All Activities Report shows transaction totals for all types of items over a specified date range. The sort by options are Activity (the most detailed level of data), Group (course groups, resource groups) and Category (products, convenience fees, etc.).
The data that shows are the categories that have been selected within the date range, with the following variables: cash, check, online credit cards, other, total payments, total refunds, total paid, credit payment, credit and total change.
This report can be exported to a variety of formats and can be printed.