PLEASE NOTE: Large organizations should avoid running the Student Report for their entire database. Be sure to use filters to avoid creating a report that is too large to handle with any efficiency.
This report shows spreadsheet-like format that displays a line-item representation of each registrant that meet the variables you have chosen.
Note! You can select the criteria from section 2a or 2b. You cannot use criteria from both sections at the same time.
You can 1 select a template and 2 configure templates based on your registration forms. This will shape the results that you see in your report, and the results that you see in your report will differ based on the criteria and template that you choose. If you select Configure this template you will have an option to 3 create a new template.
This report must be run 4 one time period at a time and can be run for all or one site, teacher, enrollment status, course group, course and class. This option can also be 5 restricted by enrollment date range. If you select this tick box, you will be able to to select a date range (option 2a). When you have selected this criteria, click 6 Filter 2a to run the report.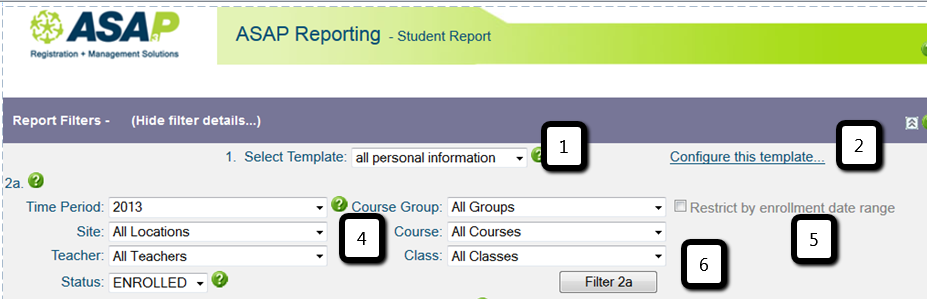
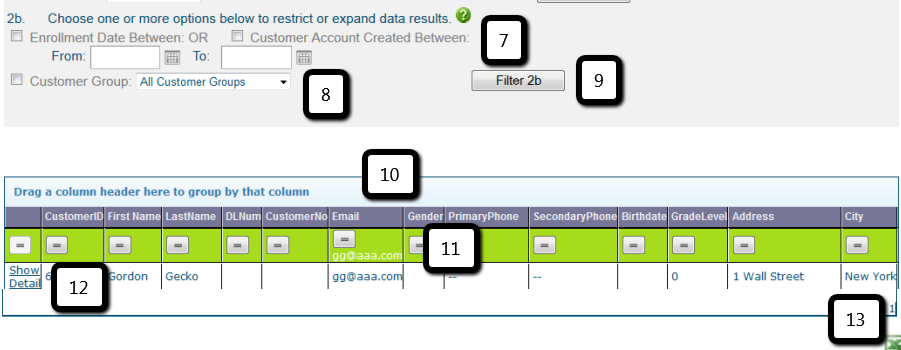
You can also run this report based on 7 enrollment or account created by date range and by 8customer group (option 2b). When you have selected this criteria, click 9 Filter 2b to run the report.
When the report has been run, you have several options in terms of what you can do with this data.
All of the variables in the report can be grouped. Simply 10 drag the header of the column you wish to group by to the header area that says Drag a column header here to group by that column and you will see the data grouped by that variable. The variables in the columns can be 11filtered with the symbol at the top of each column. Select the symbol that you want to use and type the variable that you want to see based on that symbol. Notice that this data set has been grouped by a specific email address, but you could sort by any of the criteria that you are pulling from your system. Click here for more information about grouping and filtering.
You can also select the 12 Show Detail links to the left of each line item that allow you to open the student detail screen for the student on the line item.
If you scroll towards the bottom of the report, you will see an 13 Excel icon. If you select this, you can export the full data set to Excel..